Graph Theorists Sketchpad
As part of a Graph Theory class we were given the option to create an application for our final project. Working together with a partner, we decided that we would do this option and use it as an opportunity to learn more about some graph theory concepts as well as develop our skills in web development. If you’d like to try it out click here.
This application allows you to create nodes and bridges on an interactive canvas to simulate and visualize graphs. There are various additional features that allow you to visualize graph theory concepts. We wanted our application to be accessible via a simple website so we decided to stick with a simple html/css/javascript techstack with the help of a few libraries.
The Network Canvas
The library that did a lot of the heavy lifting for us is the network portion of vis.js. This library helped us quickly lay the foundation upon which we added our features. The set up of the canvas was a straightforward process and we initially added some event listeners to buttons that managed the creation of nodes and edges. We later implemented a more seamless node and edge creation process by clicking and interacting on the canvas itself rather than having to manage through buttons.
The canvas has four modes that are toggled between by typing different keys:
- “a” enters add mode.
- “s” enters select/move mode.
- “d” enters delete mode.
- “c” enters color mode.
Instead of inputting the names of two nodes and clicking a button to create or delete edges, you simply click on two nodes while in add mode to create a new edge or you click on an edge when in delete mode to delete an edge. Similarly, to create new nodes, you just click on an empty portion of the canvas while in add mode and you delete them by entering delete mode and selecting the node you want to delete. To adjust the colors of nodes you enter color mode, select a color from the color picker, and click on the nodes you want to color.
Coloring Components
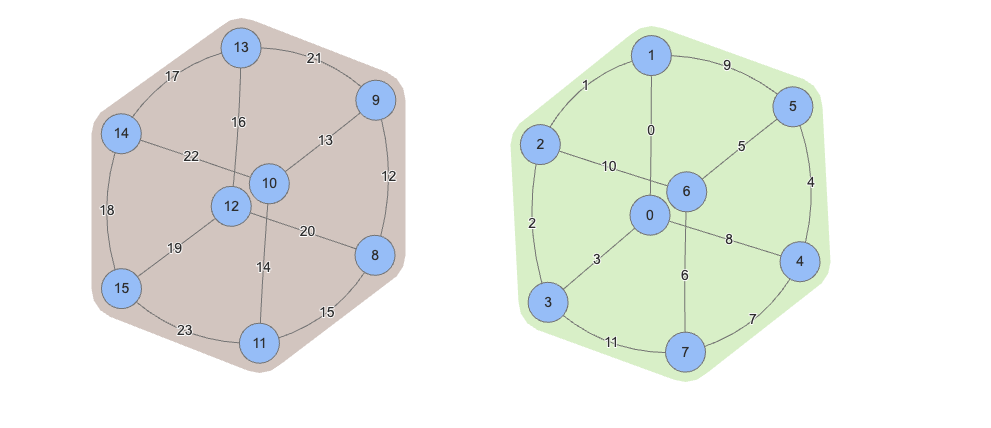
In graph theory a component of a graph is a graph where each node is connected. Using the hull.js library, we included a feature that colors the different components contained in the graph. It identifies the points contained in the component and creates a colored concave shape around it. This is easily toggled on and off via a button on the toolbar.
Dijkstra's and Directionality
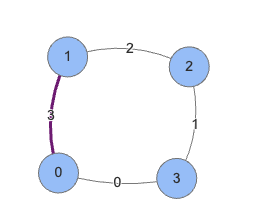
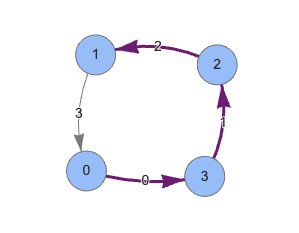
The vis.js library also makes it simple to toggle the directionality of edges. This made it interesting when implementing dijkstra's algorithm. We decided to make dijkstra’s work in both scenarios, directionally and non-directionally. You check a box to decide how you want the algorithm to behave.


Bridges
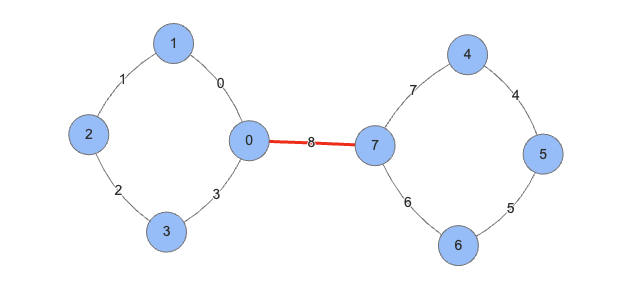
In graph theory a bridge is an edge when removed will increase the number of components of a graph. In other words, a bridge is the only edge connecting two portions of a graph. We included another feature that colors the bridges contained in a graph red.
Quick Constructions
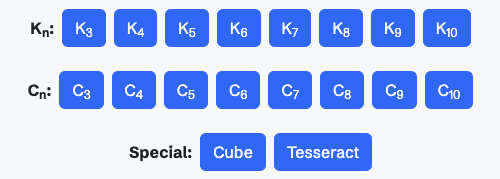
It can be tedious to manually create large graphs so we included a menu that automatically constructs a few different types of graphs. The C_n graphs are called cycle graphs. The K_n graphs are connected graphs where each node is connected. We added the cube and tesseract as a bonus as well.

Adjacency Matrix, Node degrees, and Eigenvalues
Lastly, we included a menu on the bottom that generates information about the graphs on the canvas. The adjacency matrix tab shows a matrix that displays the adjacency information between different nodes. The node degree tab shows the degree of each node, i.e. the amount of edges that are connected to it. The eigenvalues tab shows the eigenvalues and eigenvectors created from the adjacency matrix corresponding to the state of the canvas.
Conclusion
This was a fun project that stretched my abilities in a few different ways. It showed me how much can get done in 3 days when I really put my head down and code. I’ve also discovered how having tools such as this one can make learning graph theory more interesting. I like that I can easily visualize the different graphs and concepts we learned about in my class that are often shrouded in complex definitions and terminology.